Scene analysis
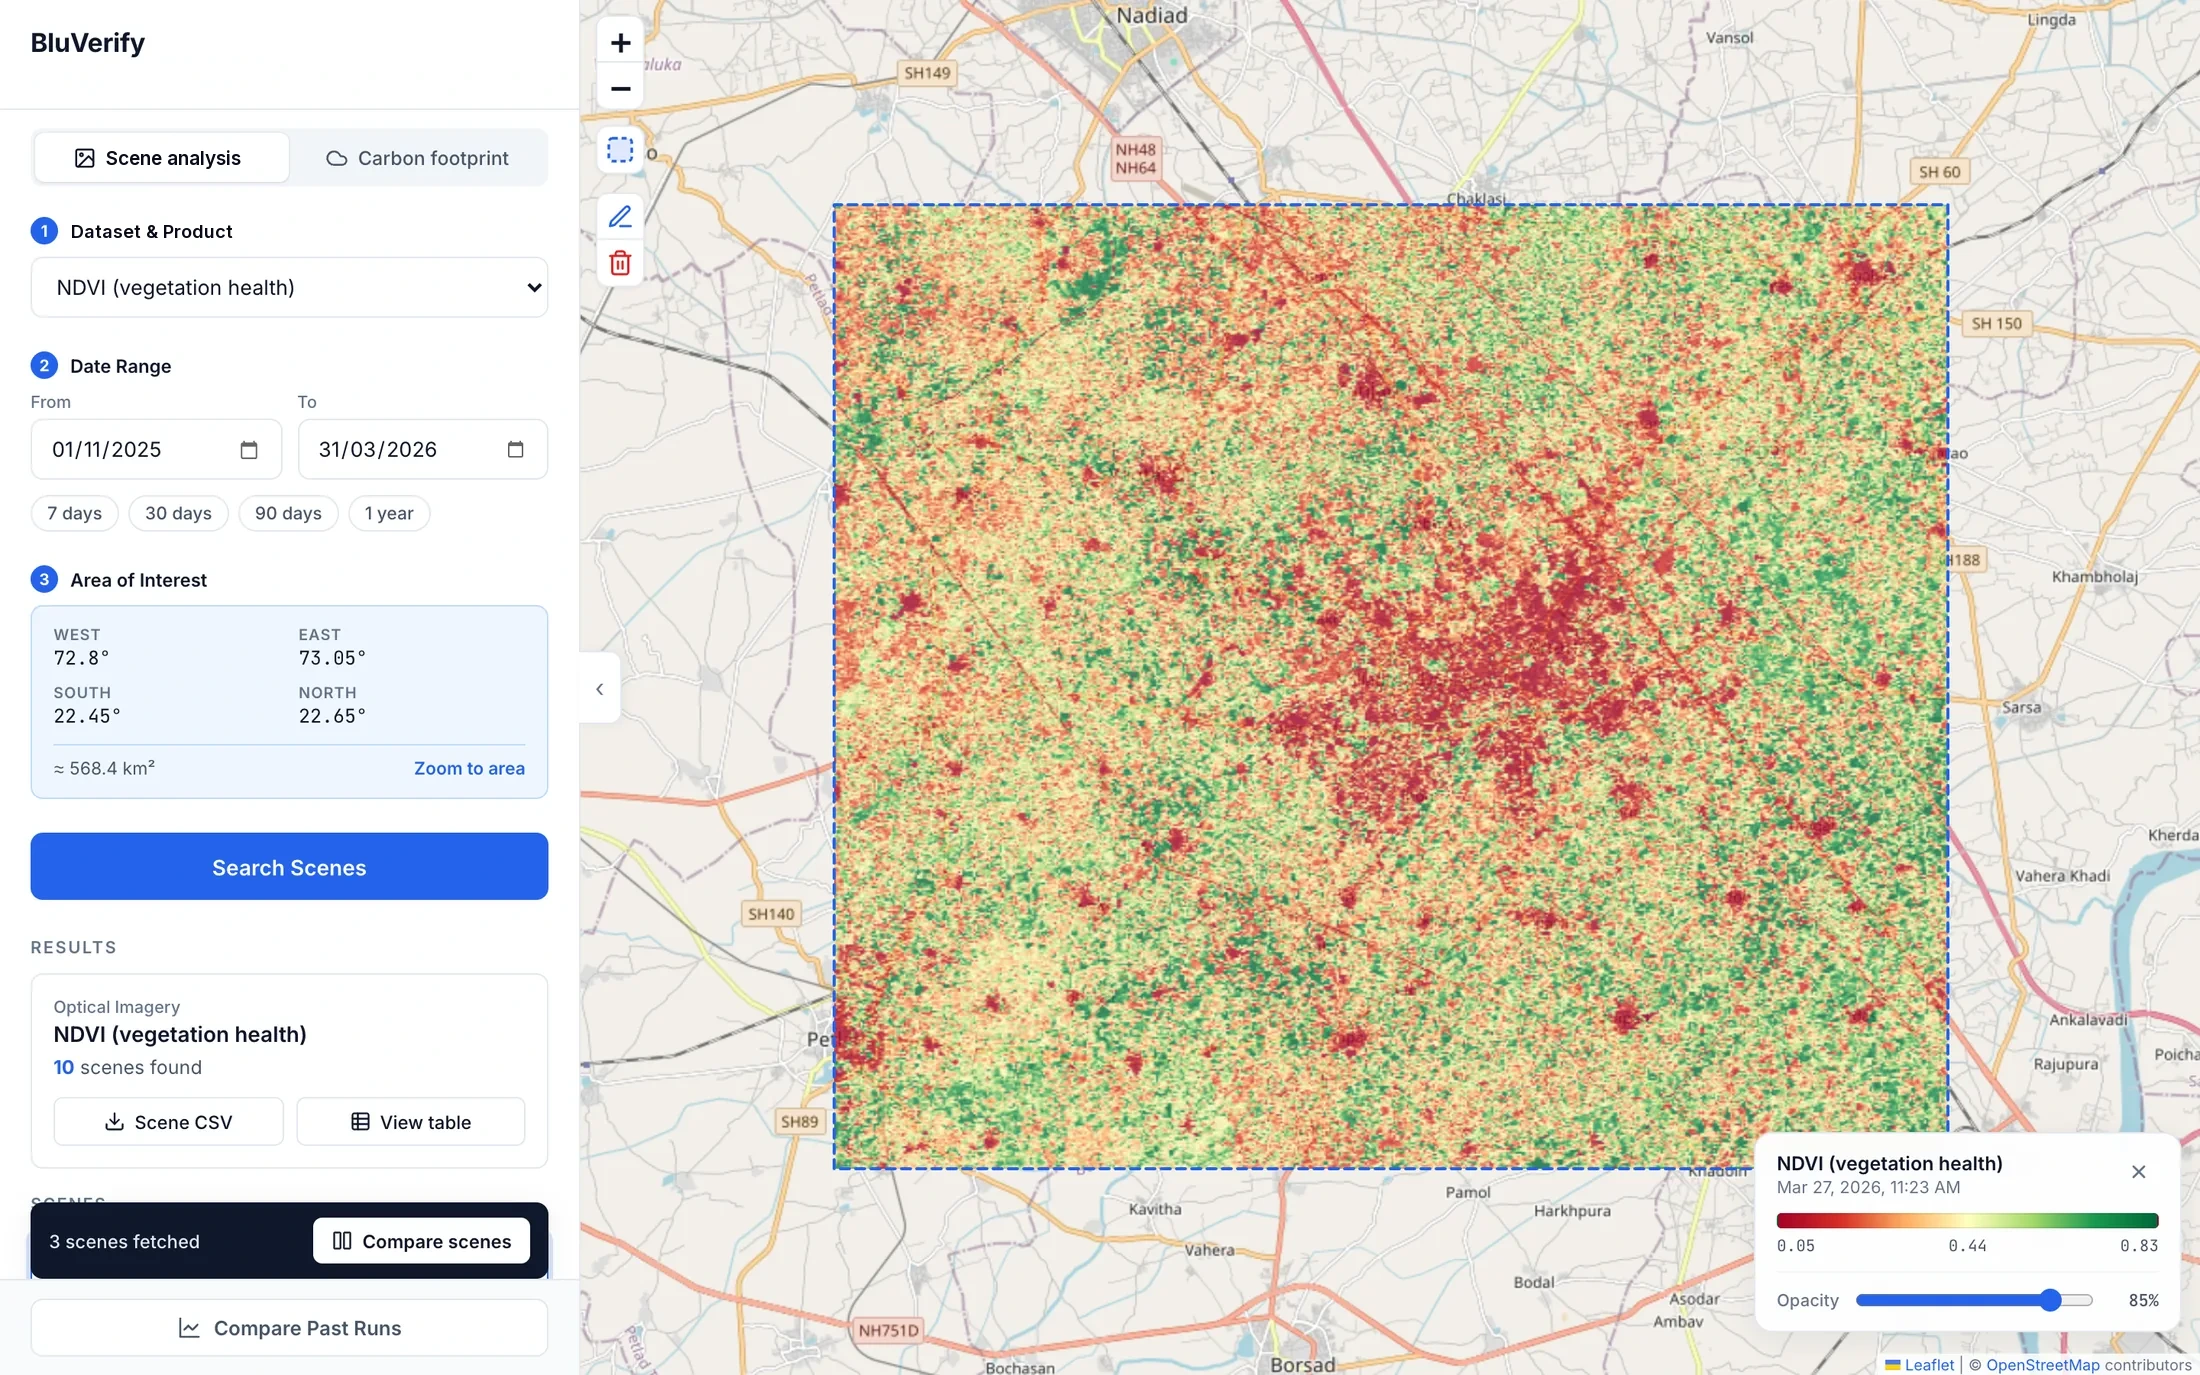
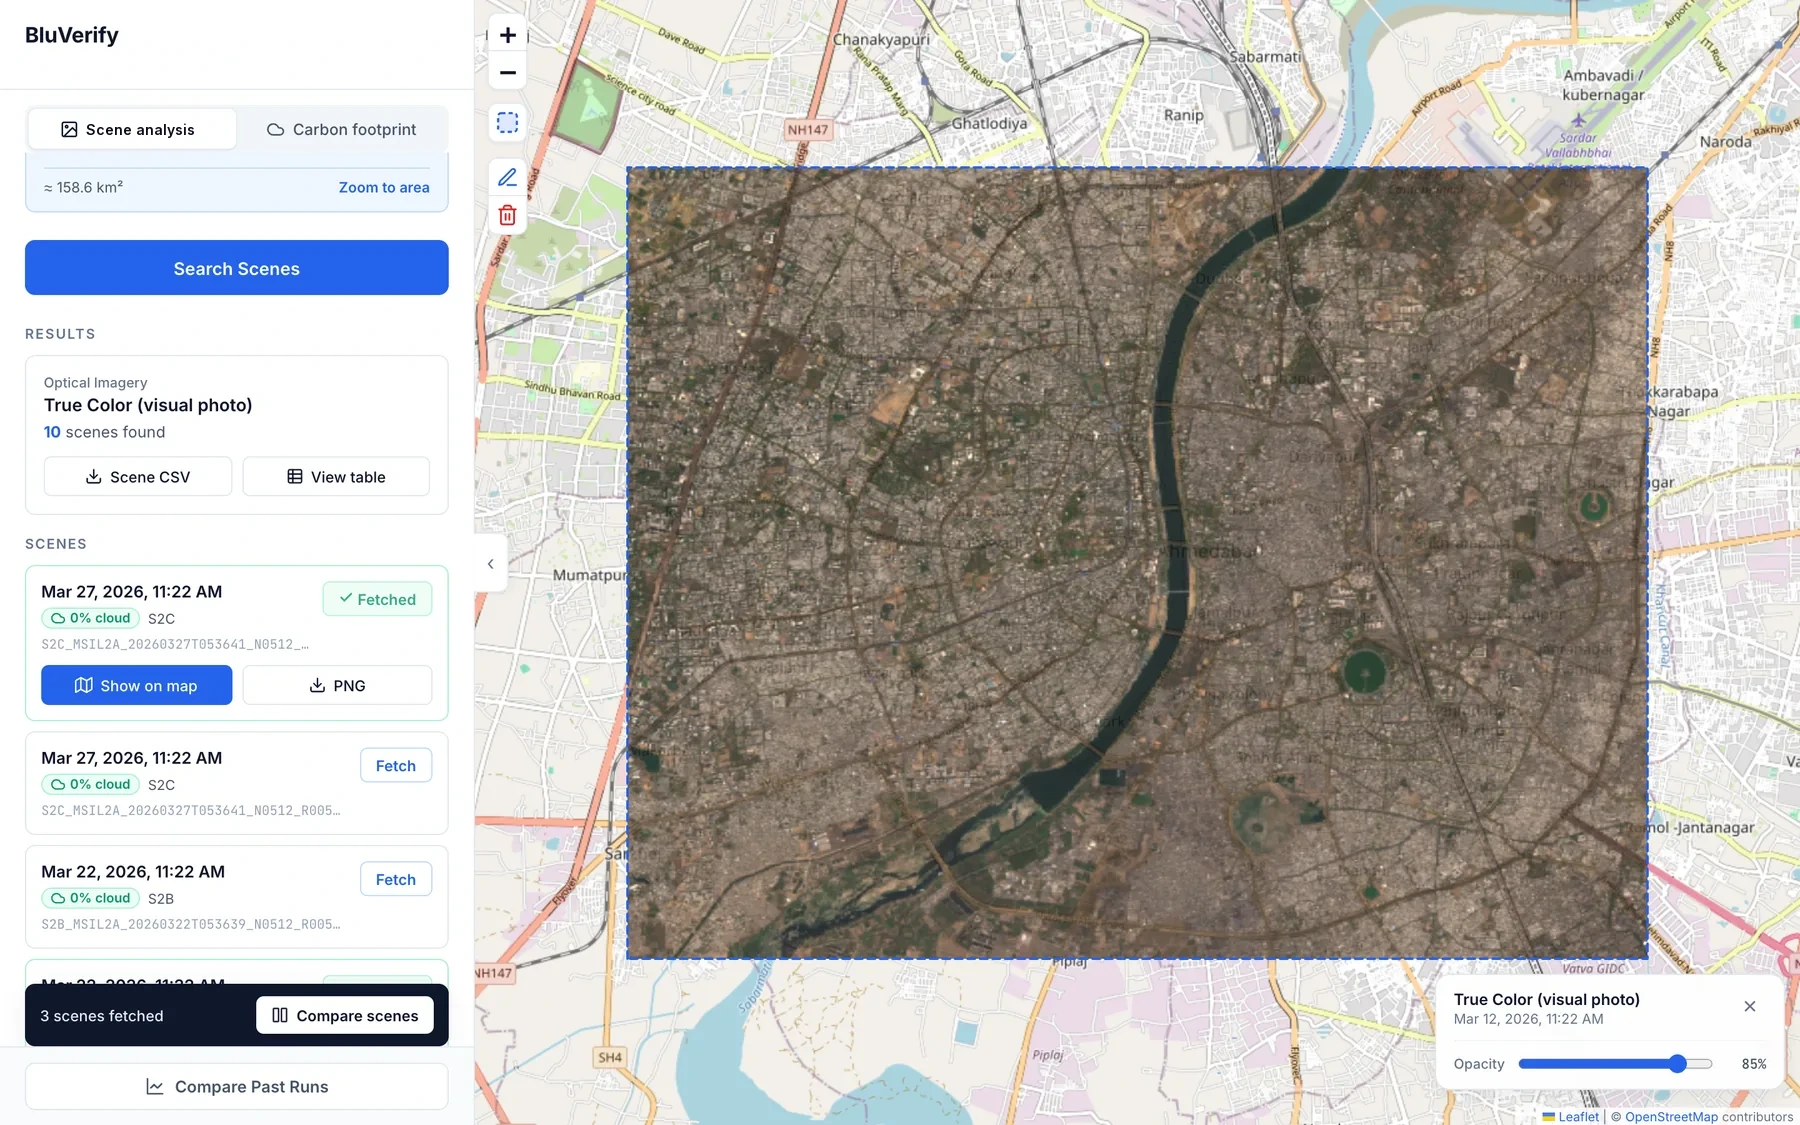
Every capture of your area and what it measured. Fifteen data products across optical, radar, thermal and air quality, each labelled with what it shows, with more than ten years of imagery behind the baseline.
Workforce & Intelligence · Available
Verify what is happening on the ground, backed by data

Satellite imagery is abundant and almost unusable without a GIS specialist sitting next to you. BluVerify is the layer above it: a map-based workspace where you draw an area, pick a product and a date range, and get back a dated assessment with the methodology and the sources attached. Scene analysis and carbon footprint sit in the same map, so vegetation, water, built-up land and emissions are read against one area of interest rather than three tools.
Every capture of your area and what it measured. Fifteen data products across optical, radar, thermal and air quality, each labelled with what it shows, with more than ten years of imagery behind the baseline.
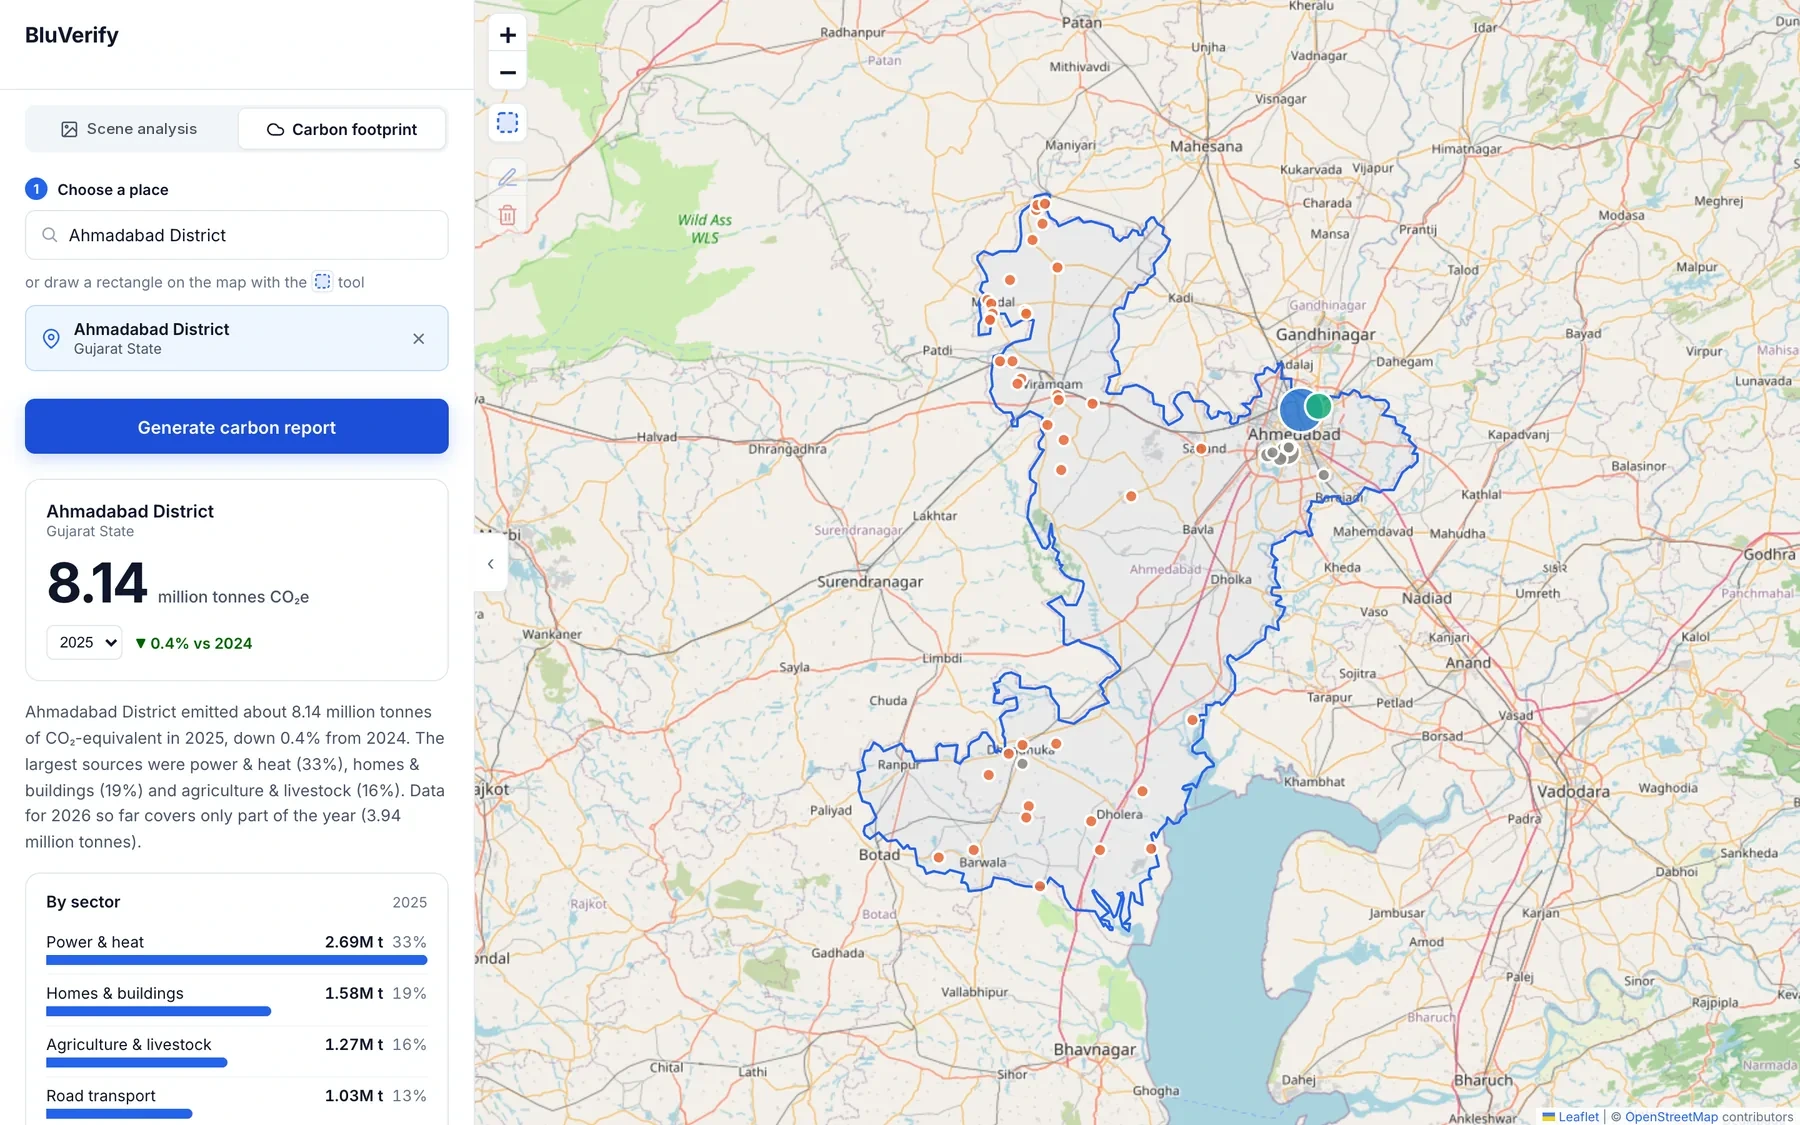
What a district emits and whether the air is changing. NO2, methane and carbon monoxide read against named facilities, so an emissions figure points at something you can visit.
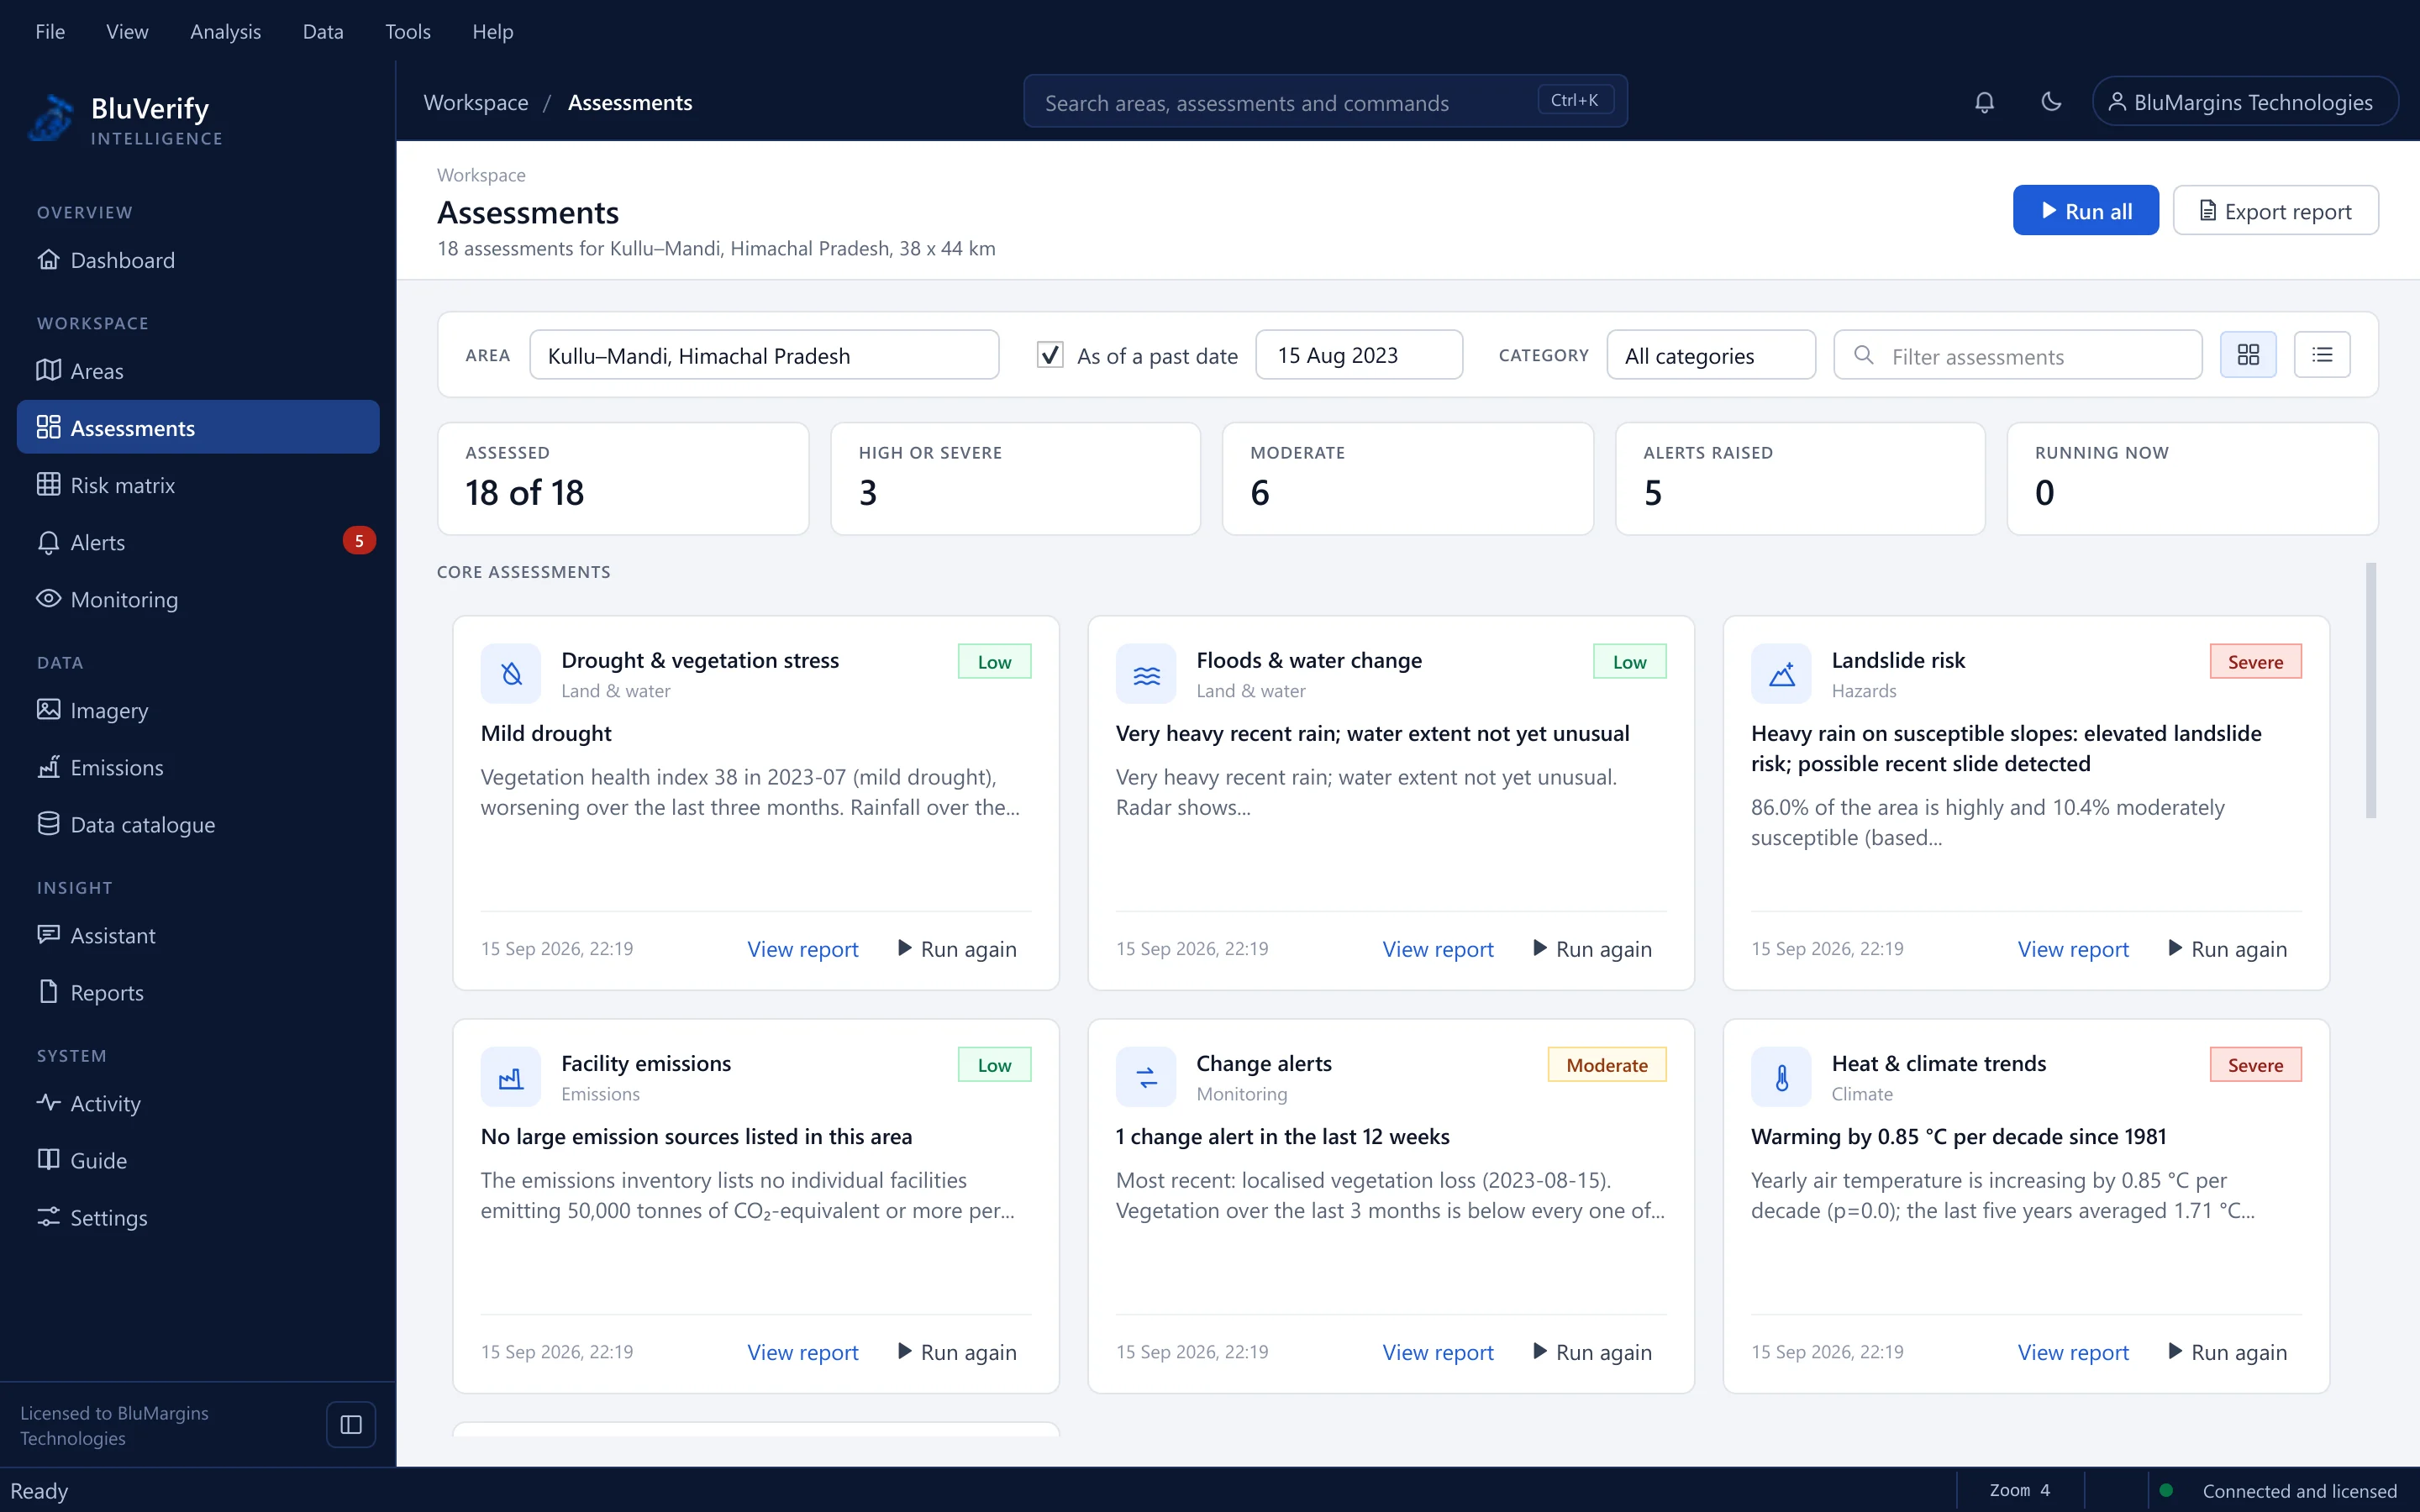
Eighteen assessments spanning drought, flood, landslide, wildfire, facility emissions and air quality, run over the area you drew rather than a preset administrative boundary.
Forecasts expressed as a probability range rather than a single number, so a reader can see how confident the system actually is before acting on it.
Raster output you can fetch, overlay and compare between dates, with opacity and legend controls for reading change rather than admiring a picture.
BluVerify Intelligence answers questions about an area in plain language, grounded in the assessments that have been run on it rather than in general knowledge.
Areas can be watched with daily checks, so a change is raised to you rather than found the next time somebody happens to look.
Exports carry their maps, methodology and sources, so a finding travels with its evidence and survives being questioned by an insurer or a regulator.
Interface previews are representative layouts. Every deployment is configured to your own modules, terminology, and branding.
The models do the reading: drought, flood, landslide, wildfire and air quality are returned as assessments of the area, not as bands a specialist still has to interpret.
Outlooks come with a probability range, because a single predicted number hides exactly the uncertainty a disaster manager needs to see.
Assessments have been run back over the Kuttanad floods, monsoon landslides, the South Lhonak glacial lake and the Wayanad landslide, and judged on what they would have said beforehand.
Questions about an area are answered from the assessments already run on it, so the response is grounded in that area rather than in something the model read elsewhere.
BluVerify is built to sit inside the estate you already run. These connectors ship with the product; anything else is an integration engagement rather than a limitation.
No, and that is the point. You draw an area, pick a product and a date range, and read an assessment. There is no projection to choose, no band maths to write, and no desktop GIS to install alongside it.
Copernicus Sentinel and Landsat for imagery across optical, radar and thermal sensors, and Climate TRACE for emissions, with our own assessment models on top. Every report names its sources.
More than ten years of historical imagery, which is what makes a baseline meaningful. Judging one season against the previous one tells you very little; judging it against a decade tells you whether it is unusual.
Yes. The assessments have been run back over the Kuttanad floods, monsoon landslides, the South Lhonak glacial lake and the Wayanad landslide, and judged on what they would have said before each one rather than after.
Each licence is issued for one computer and the application runs on the desktop. We review every access request, run a walkthrough on areas that matter to you first, and then help your team install and activate it.
How it works
The path a record takes through the product, and what the system does at each step without being asked.
Pick one of fifteen products and a date range. Presets cover the common windows, and each product is labelled with what it actually shows.
Draw a rectangle on the map. Coordinates and area in square kilometres fill in, and the sidebar flags an area too large to be useful.
Read the scene report, fetch the rasters you need, and compare dates or past runs against each other.
Run the hazard and emissions assessments over the same area, and get back a calibrated range rather than a single prediction.
Export a report that carries its maps, methodology and sources, and set the area to be watched daily from then on.
Send us how you run this today, including the spreadsheets. We will show you BluVerify against your own process and tell you plainly what it would and would not change.